Accurate remaining wall thickness estimation using the Innerspec MRUT sizing guided wave inspection technique
18/09/2026
Guided waves have been used for many years to find defects where there is no direct access to the area of interest, such as in the inspection of corrosion under pipe supports (CUPS). As this non-destructive testing methodology has matured and gained industry-wide acceptance, asset integrity requirements have become more stringent. Consequently, stakeholders now routinely demand the precise quantification of flaw morphology and severity, moving beyond mere detection.Traditional piezoelectric-based guided wave testing for defect characterisation primarily relies on either cut-off frequency or amplitude-based sizing techniques. Recent papers, however, have highlighted that the SH1 cut-off frequency approach is highly inaccurate when defects or corroded areas exhibit steep contours, whereas SH0 amplitude-based techniques struggle to resolve gradual or smooth profiles. This introduces significant shortcomings that could result in a severe underestimation of corrosion volume within a structure, potentially preventing asset owners or operators from taking remedial actions before a failure occurs.
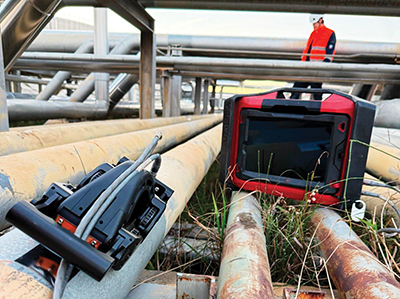 | ||
| MRUT sizing scanner on a pipe support |
To overcome these limitations, Innerspec has developed the medium-range ultrasonic testing (MRUT) sizing technique, which combines amplitude-based (SH0 wave mode) and frequency-based (SH1 wave mode) measurement techniques to provide highly accurate remaining wall thickness (RWT) measurements along the pipe. This defect sizing technique is designed to be used on pipes
6 mm to 25 mm in thickness with diameters ranging from NPS 6 to NPS 24.
By combining amplitude-based and frequency-based measurement techniques, Innerspec’s patented MRUT sizing technique provides reliable wall thickness measurements independent of the shape and depth of the corrosion.
This technique is available with Innerspec’s Volta 2 instrument and utilises the MRUT Sizing scanner for both axial and circumferential inspection. Axial scanning integrates cut-off frequency and amplitude techniques to provide accurate RWT measurements, regardless of the corrosion profile (smooth or sharp). Circumferential scanning employs amplitude-based techniques to estimate the remaining wall thickness.
The scanner generates guided waves on a magnetostrictive (MS) strip adhered axially or circumferentially to the pipe. The MS strip provides an unmatched signal-to-noise ratio (SNR), which is necessary for a high-quality assessment. For MRUT applications, it increases the SNR by more than 60 dB compared to conventional electromagnetic acoustic transducers (EMATs) with periodic magnets.
The instrument, scanner and software application have been designed for ease of use, providing a straightforward on-site deployment of a highly accurate technique. The MRUT sizing technique is available with the same instrumentation used for other MRUT and long-range ultrasonic testing (LRUT) techniques, providing a single, cost-effective platform to cover all of the guided wave inspection needs commonly encountered in the field.
An initial amplitude-based scan provides a fast assessment of the remaining wall thickness. Additional frequency-based scans taken at identified indication locations can refine the assessment when needed. These F-scans are conducted by moving the sensor to the identified locations and pressing the F-scan button. The final result, shown in the analysis step, combines both amplitude and frequency to provide an estimate of the remaining wall thickness along the scan.
Frequency scans are recommended when an area shows no reflection but significant signal attenuation, which could indicate a smooth, long defect; this scenario is especially well suited for the cut-off frequency technique provided with this scan. They are also recommended in any area where the amplitude technique has identified a large indication, to further corroborate the remaining wall thickness results.
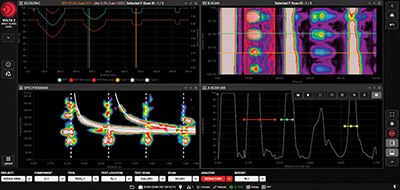 | ||
| MRUT sizing analysis view |
For a comprehensive evaluation, the software displays the final results across multiple views: a combined amplitude and frequency-sizing remaining wall chart; a spectrogram view displaying the frequency content of the SH1 cut-off signal used for the sizing process; a B-scan view; and an A-scan view that displays the corresponding signals of the selected points in the B-scan, allowing for user navigation.
The Volta 2 software applications enable automated, customised reporting. Once the inspection is finalised, the interface allows users to select specific datasets to customise the document. Reports can be exported and shared in PDF and Excel formats.
www.innerspec.com


